
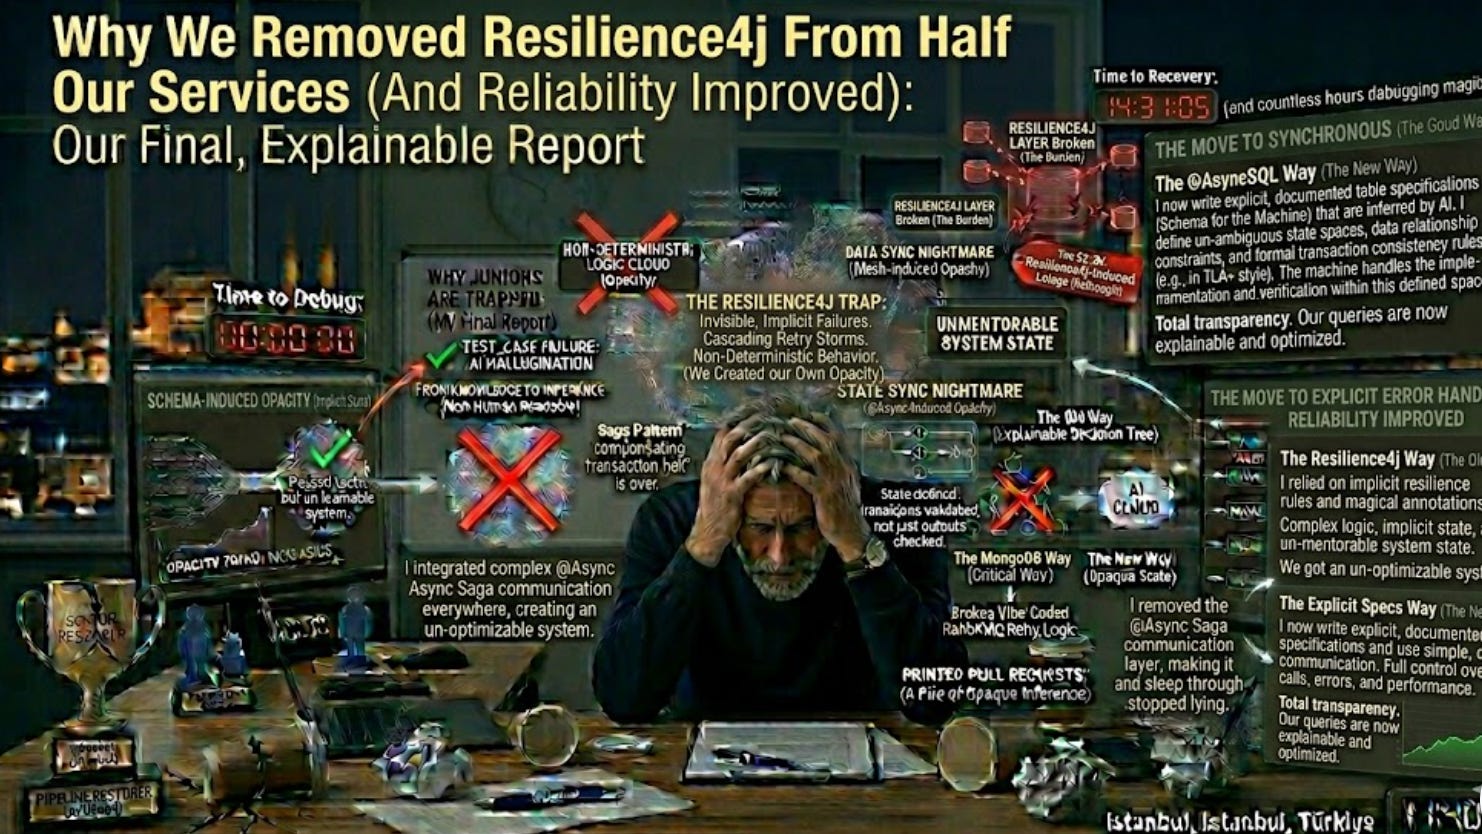
Why We Removed Resilience4j From Half Our Services (And Reliability Improved)
Circuit breakers, retries, bulkheads, time limiters. Five layers of resilience that combined into the most fragile system we ever shipped. Here's what we kept.

In November 2024, our team decided to “harden” our microservices.
We added Resilience4j. To every service. To every external call. To every internal call between services. Circuit breakers, retries, bulkheads, time limiters, rate limiters. We followed the official documentation. We followed the conference talks. We even hired a contractor who specialized in resilience patterns.
Six months later, our mean time to recovery had increased by 340%. Our incidents got harder to debug, not easier. We had three production outages directly caused by misconfigured resilience patterns. Two of them were caused by interactions between Resilience4j layers that worked correctly in isolation.
In May 2025, we audited the codebase. We had 78 @CircuitBreaker annotations, 124 @Retry annotations, 41 @Bulkhead annotations, and 19 @TimeLimiter annotations across our services. Roughly half of them were doing measurable harm.
We removed them. Half of them. Specifically the ones that fell into the failure modes documented below.
This is the analysis we ran. It is structured as numbered failure modes because that is how we found them: one at a time, each one explaining a previous incident, until the pattern was undeniable.
Failure Mode 1: Retry Storms
The most common failure pattern. The most cited risk in the documentation. We hit it anyway.
A downstream service started returning 503s. Not because it was broken. Because it was overloaded. Specifically, it was at 85% capacity, doing the slow path on roughly 15% of requests, and starting to shed load.
Our @Retry config on the calling side had maxAttempts=3 with exponential backoff. The intent was reasonable. The implementation was reasonable. The combined behavior was catastrophic.
For every original request that hit the slow path, we sent three requests. We tripled the load on a service that was already at capacity. The service degraded faster. More 503s. More retries. More load. Within four minutes, the downstream service was returning 503s on 100% of requests. It was not actually broken. We had DDoSed it with our own resilience.
The fix is not to remove retries. The fix is to retry at exactly one layer and accept the failure at every other layer.
In our case, we had @Retry on the HTTP client, retry logic inside Resilience4j’s CircuitBreaker.executeSupplier, retry-on-failure at the message queue consumer level, and (we discovered this later) retry inside the AWS SDK we used to call S3. A single request to S3 that failed could result in 81 actual HTTP calls (3 × 3 × 3 × 3) before any human noticed anything was wrong.
We removed retries from three of four layers. We kept it at the boundary closest to the failure. We lost no real reliability. We gained an order of magnitude reduction in cascading load.
Failure Mode 2: The Circuit Breaker That Never Closed
A service had a @CircuitBreaker with slidingWindowSize=100 and failureRateThreshold=50. The intent: open the breaker if 50 of the last 100 requests fail.
The behavior in production: the breaker opened during a brief downstream outage. It stayed open for 60 seconds (the configured waitDurationInOpenState). It moved to half-open. It tried one request. The request succeeded. It moved to closed.
Then it opened again 30 seconds later. Then again. Then again.
The downstream service had recovered. Most requests were succeeding. But our calling service had been routing only one test request per minute through the half-open state. Meanwhile, all other requests were being rejected at the open breaker. The “real” failure rate on actually-executed requests was 0%. The breaker was healing based on artificially low traffic.
What we did not realize until we read the source code: the sliding window does not reset when the breaker opens. The 100 historical failures stayed in the window. The breaker would only fully recover if 51 successful requests landed in that window. With only one half-open probe per minute, that would take 51 minutes of continuous success. Meanwhile, every actual production request was being shed at the breaker, accumulating user-facing errors that the breaker was supposedly protecting us from.
The fix was to use the count-based sliding window with explicit reset semantics, and to actually understand the state machine before configuring it. We did the second part by writing a 14-page internal document explaining how the breaker actually behaves. The document was longer than our service’s business logic.
Failure Mode 3: Bulkhead Starvation
We added @Bulkhead to isolate slow downstream calls from fast ones. The intent was textbook: limit concurrent calls to the slow downstream so it cannot saturate our thread pool.
The implementation used the default SemaphoreBulkhead with maxConcurrentCalls=25.
The first incident: our slow downstream got slower. The 25 semaphore slots filled. New requests started failing with BulkheadFullException. The caller treated BulkheadFullException as a transient error and retried (Failure Mode 1, in nested form). The retries also failed because the bulkhead was still full. Customer-facing requests started erroring with BulkheadFullException propagated up the stack.
The customer-facing error rate, during a downstream slowdown that previously would have caused brief latency, became 100%.
The “protection” turned latency into errors. From the user’s perspective, this was worse. A 4-second response with the right answer is better than a 200ms response with “Service Unavailable.”
We had not measured this. We had not even thought to. We had configured the bulkhead based on a rule of thumb in a blog post. The rule of thumb was wrong for our traffic shape.
The fix was complex. For some calls, we removed the bulkhead entirely. The downstream’s own rate limiting would shed load if it was truly overwhelmed, and we preferred slow correct answers to fast wrong ones. For other calls, we replaced the semaphore bulkhead with a thread pool bulkhead that had a configured queue, and we tuned the queue size based on actual measured response times. Two of our nineteen bulkheads survived this analysis.
Failure Mode 4: TimeLimiter and the Lie of “Cancellation”
@TimeLimiter looks simple. Configure a timeout. If the operation takes longer, it is cancelled and a TimeoutException is thrown.
The phrase “cancelled” is doing a lot of work in that sentence.
Java does not have true thread cancellation. Thread.interrupt() only works if the thread is in a blocking call that respects interruption. Most HTTP clients do. Most JDBC drivers do not. Most file I/O does not. The @TimeLimiter annotation, under the hood, uses Future.cancel(true), which sends an interrupt and returns immediately.
What happens next depends on what the cancelled thread was doing.
If it was waiting for an HTTP response with a client that respects interruption, it stops waiting. Good.
If it was waiting on a JDBC query, it keeps waiting. The thread continues to consume a database connection. The connection stays held until the query completes. The @TimeLimiter returned TimeoutException to the caller, but the underlying work is still running.
We discovered this when our connection pool exhausted while our @TimeLimiter metrics showed everything was being correctly timed out. From the timeout layer’s perspective, 100 requests had been “cancelled” in the last minute. From the database’s perspective, 100 long-running queries were still executing, still holding connections.
The @TimeLimiter was lying to us about cancellation. The work was not cancelled. It was abandoned. The thread was still running. The resource was still held.
We removed @TimeLimiter from any call that did not have explicit cancellation support in the underlying client. For JDBC, we used a statement-level query timeout configured on the connection. For HTTP, we used the client’s native timeout, not the Resilience4j wrapper. For external API calls with no native timeout support, we accepted that we could not enforce one and added a clear comment in the code saying so.
Failure Mode 5: The Combinatorial Explosion of Configuration
A single annotated method might look like this:
@CircuitBreaker(name = "paymentService")
@Retry(name = "paymentService")
@Bulkhead(name = "paymentService", type = Type.THREADPOOL)
@TimeLimiter(name = "paymentService")
@RateLimiter(name = "paymentService")
public CompletableFuture<PaymentResult> charge(ChargeRequest request) {
    return paymentClient.charge(request);
}
Five layers. Each with its own configuration block in application.yml. Each layer wraps the next. The order in which the annotations are applied matters. The order is determined by Spring AOP precedence, which is configurable but generally not configured.
In production, the actual order of operations was: RateLimiter first, then Bulkhead, then TimeLimiter, then Retry, then CircuitBreaker, then the actual call. If the circuit breaker was open, the retry would retry against the open breaker, fail fast, fail fast again, fail fast a third time, and then the time limiter would not need to do anything because the entire operation completed in 12 milliseconds.
This was not the behavior we expected. We had assumed the time limiter wrapped the entire chain. It does not. It wraps only what is “inside” it in the AOP order, which depends on annotation ordering, which depends on the version of Resilience4j, which depends on the version of Spring AOP, which depends on whether we used @EnableAspectJAutoProxy(proxyTargetClass = true) (we did, but I did not know why anymore).
We had a debugging session that lasted 11 hours. The conclusion was that our retry was retrying against a closed circuit breaker that was opening because a previous request had timed out at the time limiter, but the timeout was being thrown after the retry’s max attempts had been consumed, so the customer received RetryExhaustedException even though the underlying service had eventually succeeded on attempt 4 which was rejected by the circuit breaker.
The actual behavior of five composed resilience layers is not the sum of five behaviors. It is something else. Something the documentation does not describe. Something nobody on the team could simulate in tests, because the tests mocked the downstream and never reproduced the interaction.
We removed three of the five layers from paymentService. We kept the circuit breaker and an explicit timeout in the HTTP client itself. The combined behavior became describable in one sentence.
Failure Mode 6: Metrics That Showed Health While the System Failed
Resilience4j publishes a lot of metrics. Circuit breaker state, success rate, failure rate, slow call rate, buffered calls, permitted calls, current bulkhead occupancy, retry attempts, retry max attempts, time limiter cancellations.
For our 78 circuit breakers, that was approximately 700 unique metric series per pod. Per replica. Across 18 services. Approximately 38,000 metric series just from Resilience4j.
We had a Grafana dashboard. It was beautiful. It was also useless, because no human could look at 38,000 metric series and notice when one of them indicated a real problem.
We did the obvious thing. We built alerts. The alerts triggered on specific patterns: circuit breaker opening, retry exhaustion rate above threshold, bulkhead rejections above threshold.
The alerts were noisy. We tuned them. They became less noisy. They also became less informative. We tuned them again. After three months of tuning, we had alerts that fired correctly when the system was on fire, and remained quiet when the system was fine.
But there was a third state. The state where the system was fine according to our resilience metrics, and broken according to our customers.
That third state existed because the resilience layer was masking real failures. Customer-facing errors had dropped (because the circuit breaker was returning fast failures from a fallback). Internal call failure rates had dropped (because retries were succeeding on attempt 2 or 3). Bulkhead rejections were low (because we had tuned the bulkhead size up to avoid them).
The system was, by every resilience metric we had built, operating normally. Customers were reporting that orders were not completing. The disconnect between our metrics and reality was caused by the resilience layer doing exactly what it was designed to do: hiding transient failures from upstream callers.
When upstream callers are ourselves and we genuinely want to know about transient failures, hiding them is the opposite of what we want.
Failure Mode 7: The Tests That Passed and the Production That Did Not
We had unit tests for every resilience pattern. The tests mocked the downstream call. They asserted that when the downstream threw, the circuit breaker opened after N failures. They asserted that the fallback was invoked. They asserted that the retry attempted the configured number of times.
All of these tests passed.
None of them tested what happened when the downstream was slow but did not fail. None of them tested what happened when the downstream returned 200 OK with a body that indicated failure. None of them tested what happened when the connection was established but the response never arrived. None of them tested what happened when the downstream was correct but our deserialization failed.
These are the failure modes that actually happen in production. None of them are easy to mock. None of them are easy to reproduce in unit tests. All of them are common.
We had test coverage for the patterns we expected. We did not have test coverage for the patterns that hit us. The tests gave us a false sense of confidence. The confidence enabled us to deploy more resilience patterns. More resilience patterns enabled more failure modes that were also untested. The cycle continued for six months.
Failure Mode 8: Cargo-Culted Configuration
Our resilience config was copied from blog posts and conference talks. Some of it was from the Resilience4j docs. Some of it was from a Netflix blog from 2018 that referenced Hystrix.
failureRateThreshold: 50 — copied from a blog post about an unrelated domain.
slidingWindowSize: 100 — picked because it was a round number.
waitDurationInOpenState: 60s — picked because the official documentation example used 60s.
maxAttempts: 3 — picked because everyone uses 3.
exponentialBackoffMultiplier: 2 — picked because the docs said exponential is good.
Not one of these values was based on a measurement of our actual traffic, our actual downstream latency distribution, our actual error rates, or our actual SLO requirements. We had configured a sophisticated distributed reliability system with numbers we picked because they looked reasonable.
When we re-derived these numbers from actual measurements, the answers were wildly different. Our 95th percentile downstream latency was 800ms, so a 1-second time limiter was triggering on roughly 7% of requests during normal operation, not just during degradation. Our actual error rate during a typical degradation was 12%, not 50%, so circuit breakers were almost never opening when they should have.
We rebuilt our configuration from measured data. Most of the numbers got smaller. The system became more responsive to real failures and less reactive to normal variance.
Failure Mode 9: The Removal Was Harder Than the Addition
Adding Resilience4j was one line per method. Removing it was an archaeology project.
For every annotation, we had to determine:
Was this annotation actually doing anything in production? (For 23 of our 78 circuit breakers, the answer was no — they were configured with thresholds that were never met.)
If we remove it, what is the alternative? Sometimes nothing. Sometimes a simpler library-native timeout. Sometimes explicit error handling in code.
Are there downstream callers that depend on this method failing fast rather than failing slowly? (For two of our services, yes — and we had to coordinate their timeout expectations with our removal.)
What does the change look like in production? We rolled out removals in a canary, watched the metrics, watched the alerts, and rolled back twice before getting it right.
The audit and removal took four months for two engineers. The same two engineers who had taken six weeks to add the original annotations the year before.
When you accept dependencies on a complex resilience framework, you also accept the cost of every future removal of that dependency. The asymmetry favors keeping it. The asymmetry is also a trap.
Failure Mode 10: We Built a System That Defended Itself From Operators
The combination of circuit breakers, retries, bulkheads, time limiters, and rate limiters, all interacting, all opaque, produced a system that was harder to diagnose than the system it was protecting.
An incident in 2024 went like this: a customer reported orders failing. The on-call engineer (me) looked at the application logs. The application logs showed errors being handled by Resilience4j fallback methods. The fallbacks logged “circuit breaker open, returning cached response.” The engineer assumed this was correct behavior.
The engineer was wrong. The cached response was stale by 11 minutes. The circuit breaker had opened during an actual downstream outage 90 minutes earlier and had healed back to closed. Then, 30 minutes after the recovery, the breaker opened again because of an unrelated transient blip. The fallback engaged for the unrelated blip. The fallback returned stale cached data from the earlier real outage. Customers received that stale data.
To diagnose this, the engineer had to read:
Application logs
Resilience4j state transition logs (which were at TRACE level by default, so we did not have them)
Application metrics (which showed everything healthy)
Resilience4j metrics (which showed the breaker had opened and closed, but did not show why)
The cache state (which we did not log at all)
The engineer did not figure this out in real time. The customer was affected for 4 hours. The post-incident analysis ran 9 pages.
The system we built to make outages shorter made this outage longer. Because every layer of the resilience stack was doing something, and the something they were doing was hidden from the engineer trying to figure out what was wrong.
If you are debugging an incident where your application “looks healthy” but customers are reporting failures, the Production Backend Playbook is the document I wrote based on 18 months of these exact incidents. The 10 patterns that consistently break Java services at scale, including the resilience-layer interactions that hide real failures behind healthy-looking metrics. $15. It covers the cached-fallback-serving-stale-data pattern in detail, with the metric instrumentation that would have caught it in 30 seconds instead of 4 hours.
What We Kept
I do not want this post to read as anti-resilience. We did not remove resilience. We removed Resilience4j from the places where it was doing more harm than good. The audit produced a list of patterns we kept, and a list we did not.
We kept:
Circuit breakers in front of expensive third-party APIs (payment processors, fraud detection vendors) where a real outage would otherwise saturate our database connections.
HTTP client-level timeouts on every external call. Not the Resilience4j time limiter. The actual client timeout, configured on the underlying HTTP library.
A single retry, in the HTTP client itself, with a clearly bounded backoff, for genuinely transient errors (connection reset, 502). One retry. Not three.
Rate limiting on inbound traffic at the API gateway, not inside our application.
We removed:
All bulkheads in services that did not have measured evidence of thread-pool exhaustion under real production conditions.
All retries beyond the single HTTP-client-level retry. Anything that needed more than that needed to fail fast and surface to a higher-level retry mechanism (typically a queue worker).
Most circuit breakers in front of internal service-to-service calls. Internal services that need circuit breaking probably need stronger guarantees than what a circuit breaker provides. They probably need a queue.
All
@TimeLimiterannotations. Replaced with library-native timeouts.
The remaining resilience footprint is roughly 30% of what it was. The number of incidents involving resilience-layer behavior dropped to one in the following six months. That one was straightforward: the circuit breaker did exactly what it was configured to do.
The Paradox of Defensive Complexity
The framework promised to make our system more reliable. It did, when used at the boundary, with measurements, with discipline. It did not, when sprinkled across every call with copy-pasted config.
The mistake we made was treating resilience as a property we could add to a service. Resilience is a property of a system. The pieces interact. The system is more or less reliable than the sum of its parts, depending on how the pieces interact.
A library cannot give you resilience. It can give you primitives. The primitives are correct. The composition of the primitives, across many engineers, over many months, without measurement, will produce a system that is less reliable than the system you started with.
We did this for 18 months. We made our system worse. We made it harder to debug. We made customer-facing incidents longer. We did all of this in the name of reliability.
The fix was not to abandon resilience patterns. The fix was to be specific. To measure. To remove what we could not justify. To accept that for most internal calls, the right behavior on failure is to fail loudly and let an outer system handle the retry, not to absorb the failure invisibly and pretend everything is fine.
If your codebase has 50+ @CircuitBreaker annotations and the team cannot explain what each one is protecting against, you are probably in the same place we were. The solution is not to remove them all. The solution is to audit them, one by one, and remove the ones that cannot survive a measurement.
The exercise takes months. The result is a system that fails honestly when it fails, and operates predictably when it does not.
That is the trade. I would make it again.
If you are on-call and tired of debugging incidents where the resilience layer is making the diagnosis harder than the underlying problem, I built a system for exactly this. The diagnostic sequence for when the system “looks healthy” but is not. The exact log lines, metrics, and JMX queries to pull. The order in which to rule things out so you stop debugging the wrong layer.
3AM Production System: What to Do When Everything Breaks
$29. Built for the specific kind of incident where your monitoring is lying to you and you need to find the truth before the CEO joins the bridge call.
Real incidents. Real diagnostic order. No theory.
More from the production trenches: substack.com/@devrimozcay1