
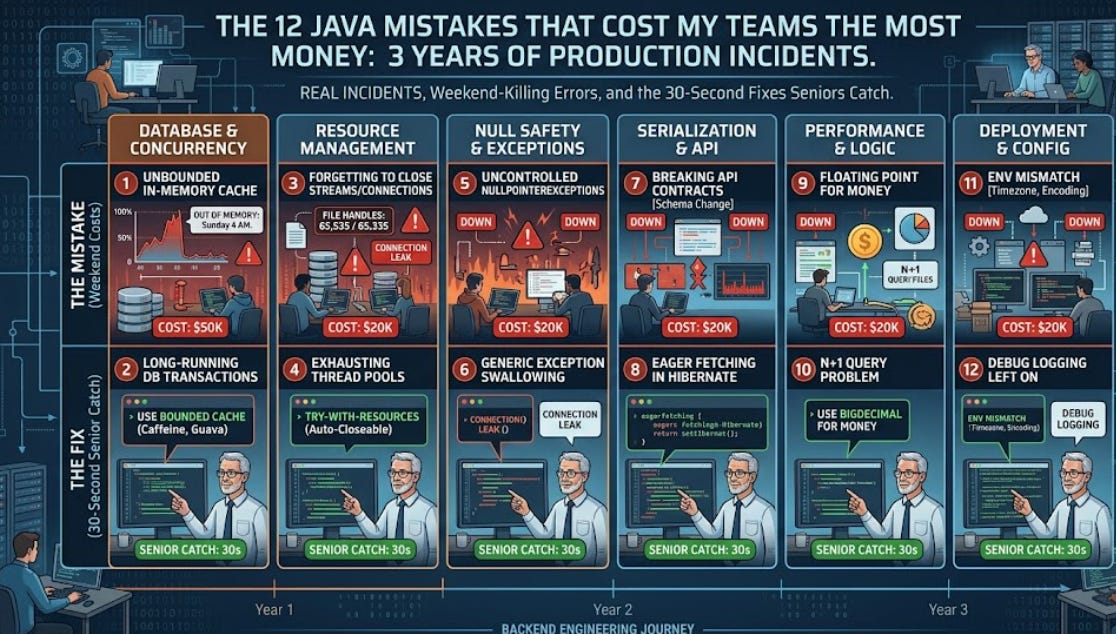
The 12 Java Mistakes That Cost My Teams the Most Money
Real production incidents from 3 years of backend engineering. The mistakes seniors catch in 30 seconds after they've already cost someone a weekend.

I’ve been writing Java in production since 2022. Different companies, different stacks, different on-call rotations. Different ways of breaking the same things.
Some of these I caused. Some I inherited and had to debug at 2am. Some I caught in code reviews after seeing them blow up twice already. None of them are exotic — that’s the point. The mistakes that actually cost money in production aren’t the clever ones. They’re the boring ones nobody talks about because they’re embarrassing.
Here are the 12 I keep seeing.
1. @Transactional on a private method
What it costs: Silent data corruption. You don’t know it’s happening until customer data is wrong.
I had a service running in production for 18 months with @Transactional on a private method. The annotation did literally nothing. Spring’s transactional proxy can’t intercept self-invocations or private calls. Every save that “should have been atomic” was actually running without transaction boundaries.
We only found it when a customer reported missing order line items. The order was committed. The line items weren’t. The two operations were supposed to be one transaction. They weren’t.
The fix: Move the method to a separate @Service bean, or use AspectJ weaving instead of proxy-based AOP. Most teams don’t even know there’s a difference.
Code review tell: Any @Transactional annotation on a method that isn’t public. Any @Transactional method being called from within the same class.
2. Catching Exception instead of the specific type
What it costs: Two weeks of debugging the wrong cause.
I once spent 11 hours debugging what I thought was a Redis connectivity issue. The real cause was an OutOfMemoryError being silently swallowed by a catch (Exception e) block that logged “redis timeout” because that was the most recent log line before the catch.
Exception doesn’t catch Error. But it catches everything else — including RuntimeException types you never wanted to handle, like NullPointerException and IllegalStateException. Your “graceful degradation” becomes a black hole that hides every real problem.
The fix: Catch specific exception types. If you absolutely need a fallback, catch Throwable and log the actual class name. Never assume the exception is what you think it is.
Code review tell: catch (Exception e) with a generic log message. catch (Throwable t) without rethrowing.
3. equals() without hashCode()
What it costs: Data loss in HashMaps and Sets.
A teammate added a custom equals() to a domain object so two instances with the same business key would be considered equal. He forgot hashCode(). We had a Set<Order> deduplication step in our pipeline. Duplicates piled up silently. Three weeks later we noticed our daily reconciliation reports were off by 4-7%.
The bug was deployed for 19 days before anyone caught it.
The fix: Always override both, together. Lombok’s @EqualsAndHashCode handles it. So does IDE auto-generation. There’s no excuse.
Code review tell: A class with equals() but no hashCode(). The reverse case (only hashCode()) is also broken but rarer.
4. Unbounded thread pools
What it costs: A node death spiral. Then auto-scaling. Then the AWS bill.
Executors.newCachedThreadPool() looks innocent. It creates threads on demand and reuses idle ones. What the Javadoc buries is the word “unbounded.” Under load, this pool will happily create 50,000 threads before the JVM dies.
I inherited a service that was using newCachedThreadPool for an async webhook dispatcher. Normal traffic: fine. A bad weekend with a downstream partner returning slow 503s: every webhook started timing out, every retry spawned a new thread, the pool ballooned to 12,000 threads. The JVM ran out of native memory before it ran out of heap. The instance died. Auto-scaling brought up four more. They all died. By the time someone paged me, AWS had scaled us to 28 instances. Bill for the weekend: $1,847.
The fix: Always bound your pools. Use ThreadPoolExecutor directly with explicit corePoolSize, maximumPoolSize, and a bounded LinkedBlockingQueue. Reject extra work with CallerRunsPolicy or a custom handler.
Code review tell: Any Executors.newCachedThreadPool() or Executors.newFixedThreadPool(Integer.MAX_VALUE). Any ThreadPoolExecutor with new LinkedBlockingQueue<>() (no bound argument — defaults to unbounded).
5. N+1 queries hidden by Hibernate’s lazy loading
What it costs: A 50ms endpoint in staging becomes a 12-second endpoint in production.
The setup that bit me: a User entity with a lazy-loaded List<Order> relationship. The repository returned 50 users. The serialization layer touched getOrders() on each one. 50 additional queries. Database CPU went from 12% to 94%.
This is the most documented Java mistake in the world. People still ship it weekly. The reason: in staging, with 20 users and 3 orders each, the query overhead is invisible. In production, with 50,000 users and 200 orders each, it becomes everything.
The fix: Either explicit JOIN FETCH in the JPQL query, or @EntityGraph annotations, or moving to projection DTOs that only load what’s needed. Whatever you do, log SQL in production for the first month after any new endpoint. Look at the count.
Code review tell: A findAll()-style query followed by a .stream().map() that touches a lazy relationship. Almost always a hidden N+1.
6. HikariCP maxPoolSize left at the default of 10
What it costs: Connection pool exhaustion under load. Every request hangs.
The default is 10 because the docs say “for most applications, 10 is enough.” This is technically true and practically misleading. Most apps don’t hit it. The ones that do hit it spectacularly.
We had an endpoint that made three sequential database calls per request. Under 30 concurrent requests, we needed up to 90 connections momentarily. The pool was set to the default 10. Requests started queueing. Then timing out. Then the upstream service started retrying. Within 4 minutes, every request to the service was failing.
The fix: Calculate the actual concurrent connection demand. Generally, maxPoolSize = (core_count * 2) + effective_spindle_count is the PostgreSQL guidance, but for application-tier pools, you need to multiply by the number of concurrent requests you expect to serve per node. Then add 20% headroom. Set connectionTimeout low (2-3 seconds) so failures are loud, not silent.
Code review tell: No explicit spring.datasource.hikari.maximum-pool-size configuration. Any application property file that doesn’t override HikariCP defaults.
7. Missing @Indexed on a find by foreign key query
What it costs: A full table scan on every API call.
We added a findByCustomerId(Long customerId) repository method. The customer_id column had no database index. For the first 6 months, with 4,000 customers, the table scan was 8ms. By month 18, with 280,000 customers, it was 4.2 seconds. The endpoint that used it was the homepage.
The thing that frustrates me about this one: nobody added it intentionally. The migration that created the orders table indexed the primary key and the created_at column. Foreign keys were declared but not indexed. PostgreSQL doesn’t auto-index foreign keys. Most developers assume it does.
The fix: Every foreign key gets an index. Add it in the migration that creates the table. Audit existing tables with pg_stat_user_indexes for missing indexes on columns used in WHERE clauses.
Code review tell: Any new findBy<ForeignKeyField> method in a Spring Data repository without a corresponding CREATE INDEX in the latest migration.
8. LocalDateTime in entities (no timezone)
What it costs: Reports off by one day after daylight saving time changes. Audit logs that can’t be correlated across regions.
LocalDateTime has no timezone. It’s just a wall-clock value. When you save it to the database, the JDBC driver interprets it in whatever timezone the connection happens to be in. When you read it back, same thing — but the connection’s timezone might be different now because you restarted the service in a different region.
Daylight saving time amplifies this. A LocalDateTime of 2024-03-31 02:30:00 doesn’t exist in many timezones. Spring serializes it. The database accepts it. Then the report generator queries it and crashes.
The fix: Use Instant for anything stored in the database. ZonedDateTime if you genuinely need timezone information for display. LocalDateTime only for cases where you genuinely mean “wall clock, no timezone” — which is almost never for business data.
Code review tell: LocalDateTime on any entity field. Especially on createdAt / updatedAt.
9. Returning null from a Stream operation
What it costs: NullPointerException two layers up the call stack. Hours of debugging.
return users.stream()
    .map(this::enrichUser)
    .collect(Collectors.toList());
If enrichUser returns null for any user, the list now contains nulls. The caller iterates it, calls a method on each element, NPE. The stack trace points to the caller, not to enrichUser. You spend 90 minutes looking in the wrong place.
The fix: enrichUser should return Optional<User> and the stream should .filter(Optional::isPresent).map(Optional::get). Or return null and .filter(Objects::nonNull). Either way, the intent is explicit.
Code review tell: Any .map() operation where the mapping function can return null. Any .collect(Collectors.toList()) without an upstream null filter.
10. Retry storms
What it costs: A 3-second downstream blip becomes a 45-minute outage.
A downstream service slowed down. Our HTTP client (with default retry settings) tried 3 times per request. The 3 retries happened in 300ms. Each retry also timed out. The original 1 request became 4 requests against a service that was already struggling. The service got even slower. Our requests retried more. The downstream service fell over completely.
This is called a retry storm. It’s also called “the metastable failure mode.” Brendan Gregg has written about it. So has the AWS Well-Architected Framework. It still happens constantly.
The fix: Exponential backoff with jitter. Circuit breakers (Resilience4j is the standard now). Hard caps on total retry budget per request. And — controversially — sometimes the right answer is to retry zero times. If the downstream service is failing, retrying does not help.
Code review tell: Any @Retryable annotation without backoff = @Backoff(delay = ..., multiplier = ..., random = true). Any HTTP client with default retry configuration.
11. Logging sensitive data into long-term storage
What it costs: A compliance incident. Potentially a fine.
log.info("Processing payment: " + paymentRequest) looks harmless. Then it turns out paymentRequest.toString() includes the card PAN. Now your CloudWatch logs have card numbers in them. Your compliance team has a very serious conversation with you.
I’ve seen this exact pattern three times across different teams. It always feels like “we’ll fix the toString() later.” Then later doesn’t come.
The fix: Annotate sensitive fields with @ToString.Exclude (Lombok) or override toString() manually. Better: never put PII or credentials in log strings at all. Log identifiers, not payloads. If you need the full payload for debugging, use structured logging with a separate sensitive-data sink.
Code review tell: Any log.info/log.debug with string concatenation involving request, response, or domain objects. Any toString() on a class containing PII fields.
12. Spring Boot Actuator endpoints exposed to the internet
What it costs: Full heap dump exposure. JVM stats. Configuration values. Sometimes credentials.
The default Actuator configuration in older Spring Boot versions exposed /actuator/env, /actuator/heapdump, /actuator/configprops over HTTP without authentication. You could curl a production service and download its entire memory state.
I once joined a team where an Actuator endpoint had been public for 4 months. Nobody knew. The heap dumps contained AWS access keys (loaded from env vars into Spring beans, then sitting in memory). Rotating those keys took two weeks because they were used in 31 different services.
The fix: management.endpoints.web.exposure.include=health,info and absolutely nothing else by default. If you need more, expose it on a separate management port that isn’t routable from the internet. Add Spring Security to the management endpoints regardless.
Code review tell: Any management.endpoints.web.exposure.include=* in application.properties or application.yml. Any deployment that doesn’t separate management port from application port.
The pattern behind all 12
If you read carefully, these mistakes have something in common.
They’re not knowledge gaps. Anyone who has worked in Java for two years has heard of N+1 queries, has read about @Transactional, knows that equals and hashCode go together. The mistakes aren’t ignorance.
They’re moments of inattention under pressure. You’re three sprints behind, the PM is asking for status, and you write catch (Exception e) because it’s faster than thinking through what could throw. You leave maxPoolSize at the default because the docs said it was fine. You log the whole object because you’re debugging at midnight and you’ll “clean it up tomorrow.”
Production engineering isn’t about knowing more. It’s about building habits that hold up under load — including when the load is on your own attention, not just on your service.
That’s why code review tells exist. They’re the second pair of eyes that catches the moment of inattention. The senior engineer scanning a PR isn’t smarter than the author. They’re just less tired in that moment.
If you found this useful, I write one production deep-dive every week on Substack — actual incident timelines, actual numbers, actual lessons. No “10x engineer” stuff, no career advice that sounds like a LinkedIn post. Join 100+ backend engineers who already get it.
I also catalogue these patterns in more detail in Production Engineering Toolkit — the 12 Java mistakes above, plus case studies, code samples, and the exact remediation steps I use in code reviews. If you’ve ever wanted a checklist for “what to look for before merging,” it’s that.